Project RISING
Resilient Intelligent Surveillance & Integrated Next-Generation Healthcare
A climate-resilient health-data platform designed around one principle: no critical health record should be lost during climate-induced connectivity failures.
The challenge
Typhoons, floods, power outages, and weak rural networks can delay, duplicate, corrupt, or erase healthcare data. Project RISING demonstrates how a pipeline can continue behaving predictably during disruption—not only when every dependency is healthy.
Solution architecture
Batch engineering
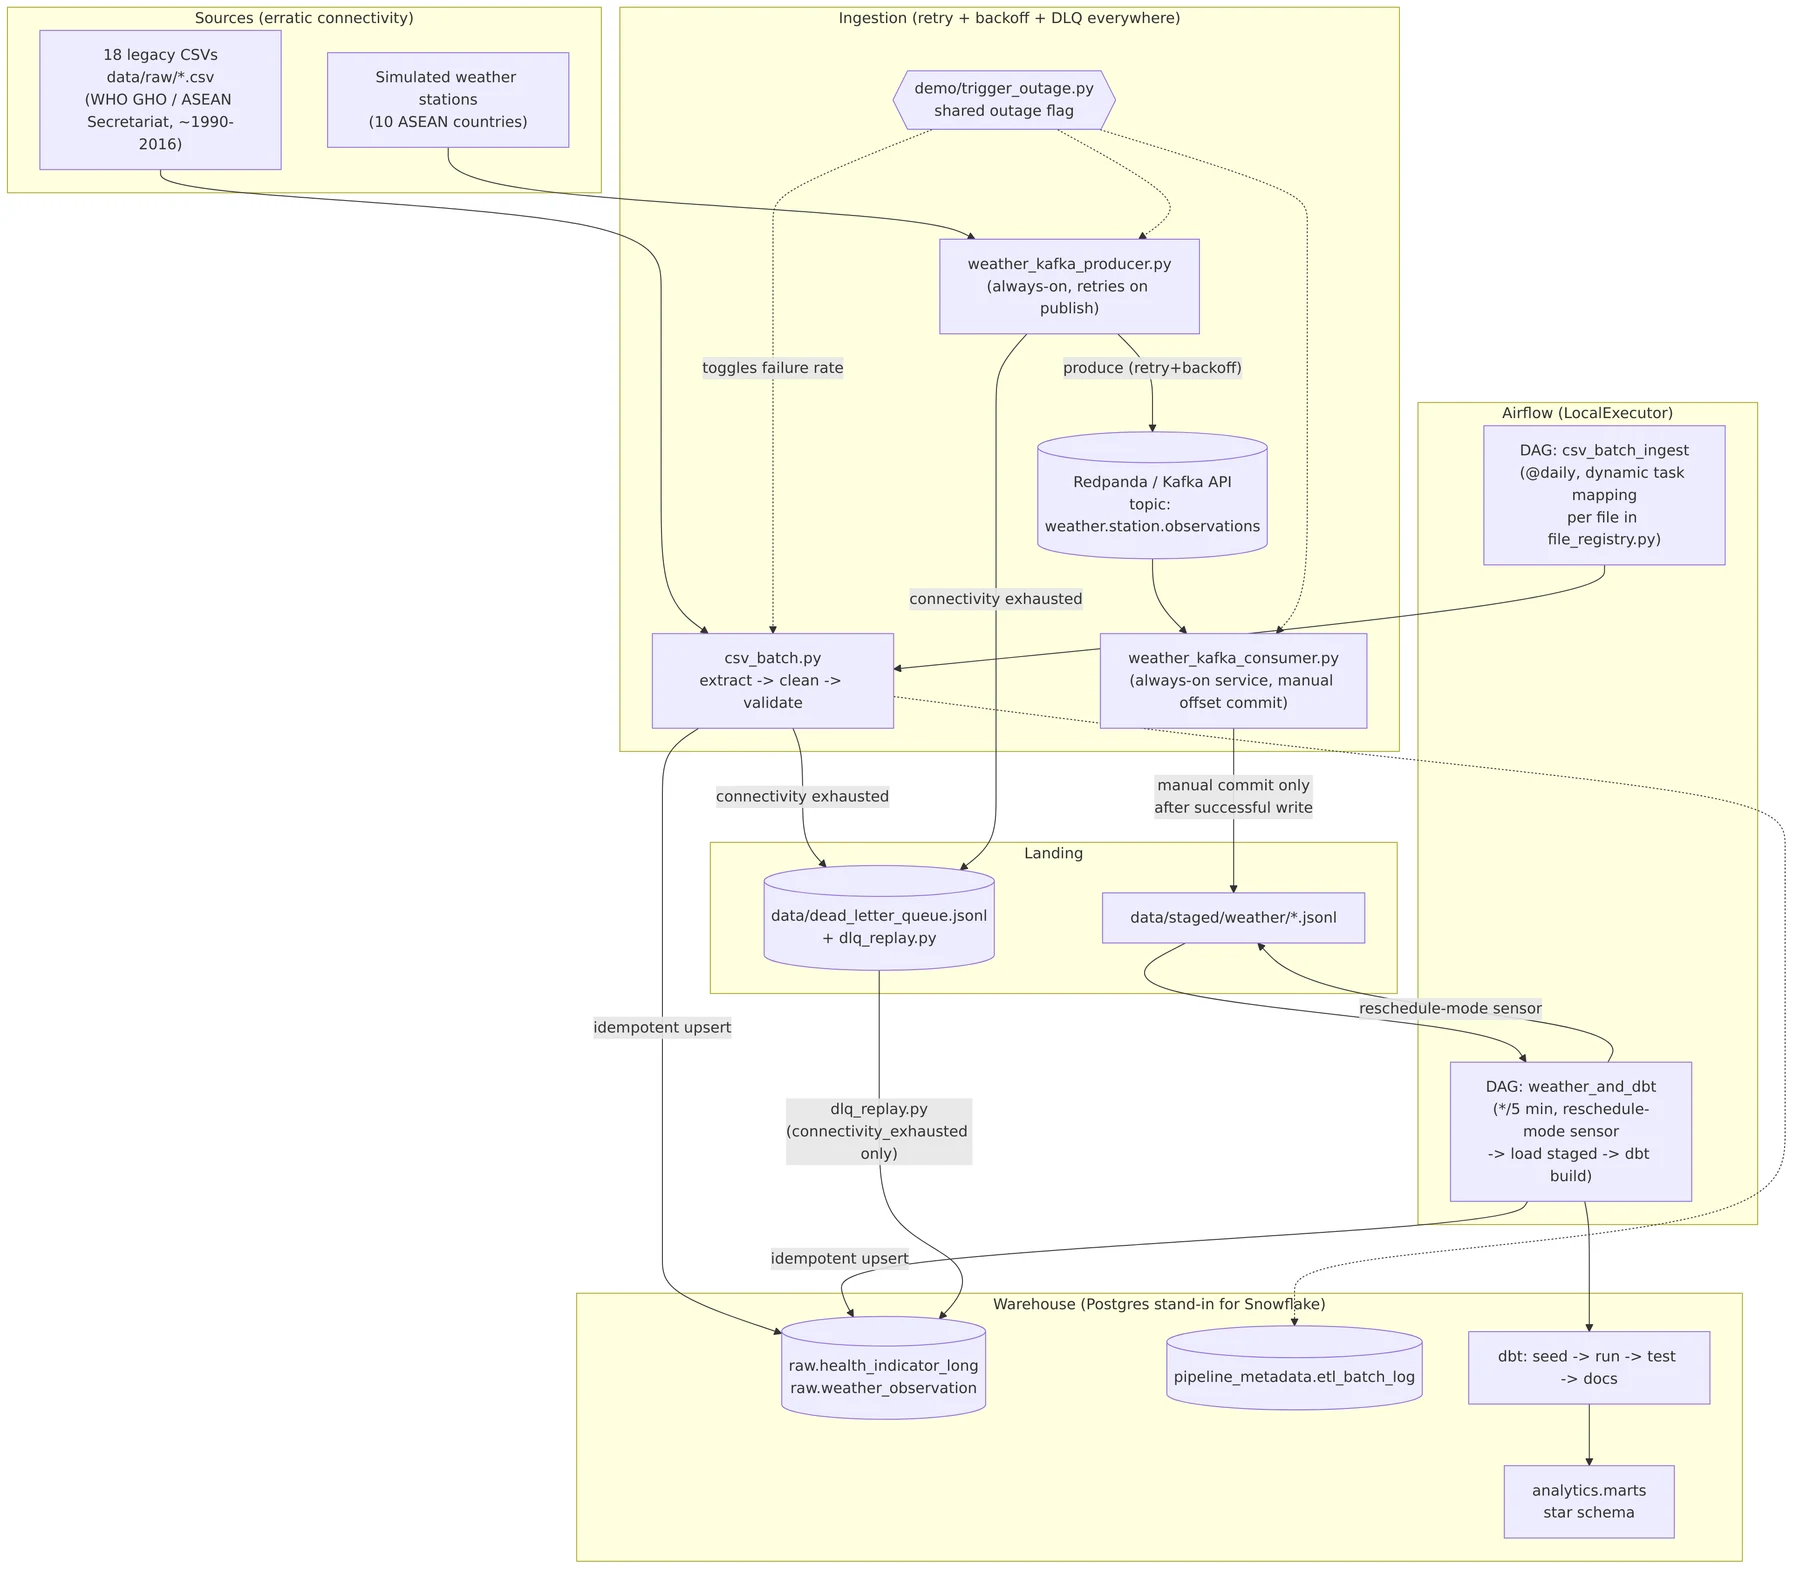
Historical ASEAN and WHO-style health indicators arrive as inconsistent CSV files. The Python pipeline handles encoding differences, standardizes columns and country names, reshapes year columns from wide to long format, cleans mixed numeric values, and processes sex-specific and sub-indicator fields.
Pandera schemas and targeted validation guard required fields, ASEAN membership, years, numeric values, metadata, and duplicate observations before processed data is trusted.
Failure-aware streaming
The streaming demonstration validates simulated weather and sensor events, introduces a network failure, buffers the affected event, and retries it when connectivity returns. Event IDs and checkpoints make reprocessing idempotent. Invalid records are isolated in JSONL dead-letter storage for review instead of silently contaminating accepted data.
Warehouse design
Dimensions
Country · Indicator · Date · Source · Station · Quality status
Facts
Health observations · Weather observations
Operations
Pipeline runs · Processed files and events · Dead letters · Pipeline metrics
Data quality and testing
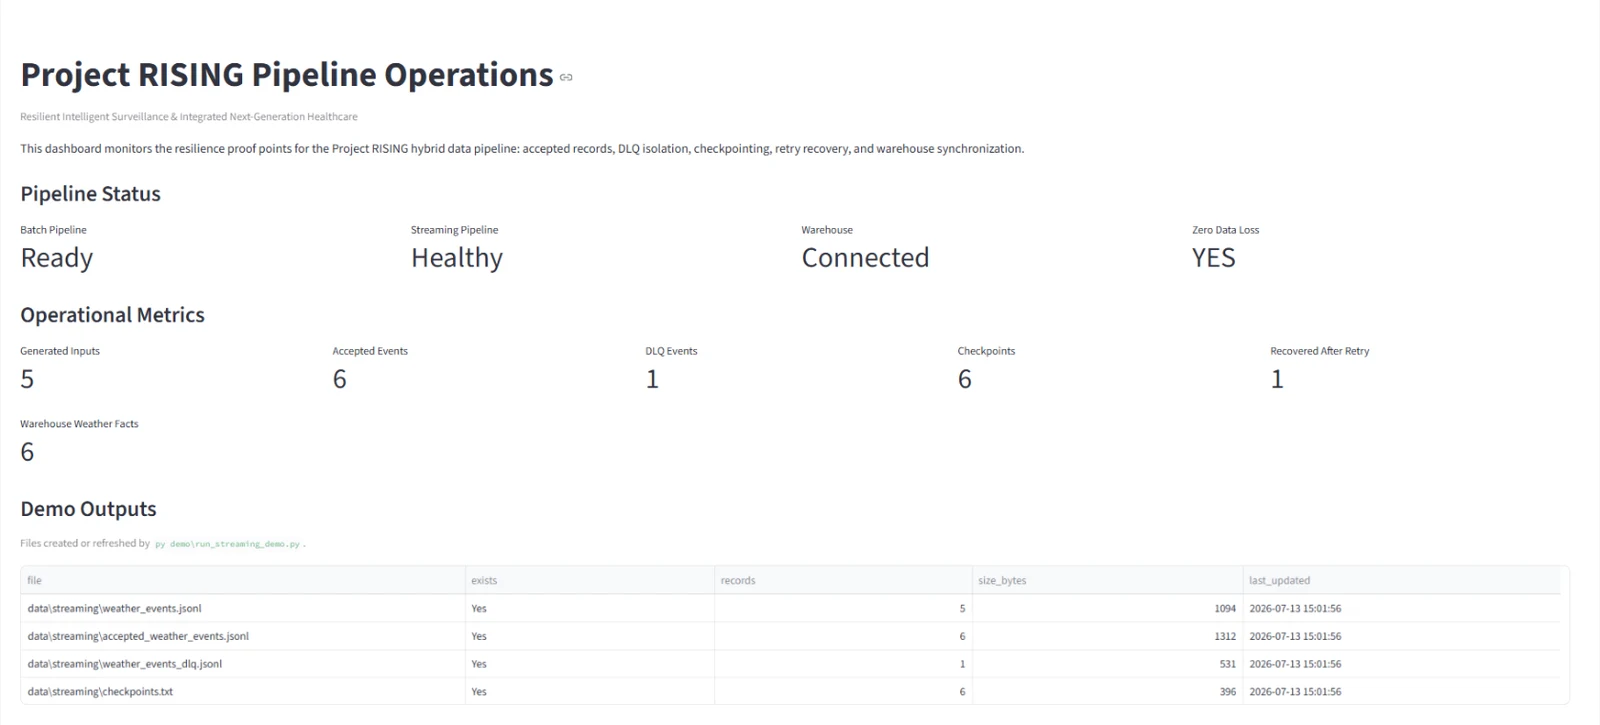
Automated Pytest coverage checks ingestion, transformation, schema validation, retry behavior, DLQ routing, checkpoint deduplication, and warehouse-loading helpers. The dashboard exposes batch and streaming status, warehouse connectivity, accepted and rejected events, checkpoints, retry recoveries, and the zero-loss status.
Measured demonstration
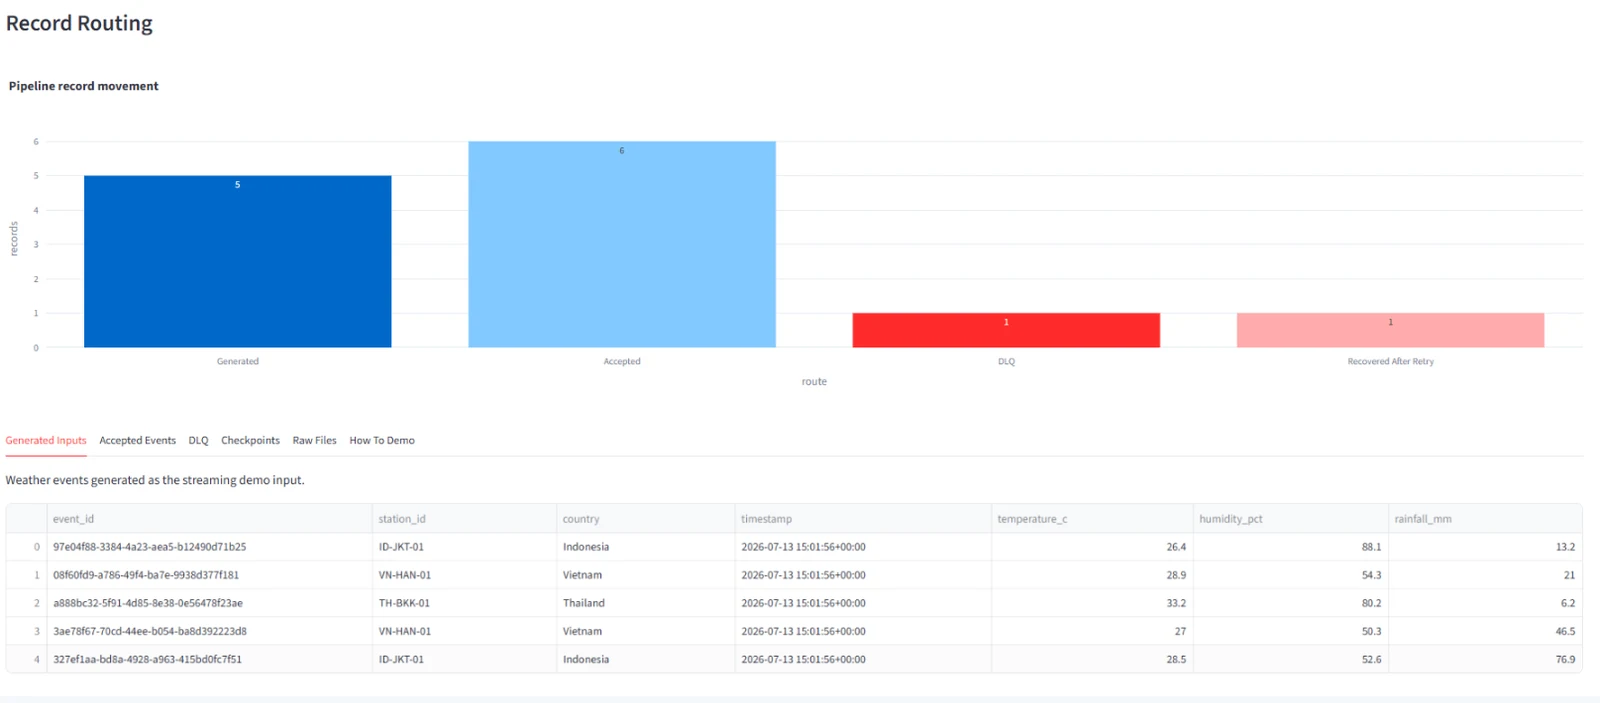
- Six accepted streaming events were generated, preserved, and loaded into PostgreSQL.
- One simulated network failure recovered after retry.
- One malformed event was routed to the dead-letter queue.
- A duplicate event was blocked through checkpointing.
- No trusted record was intentionally lost during the simulated disruption.
Engineering decisions
The MVP deliberately uses reproducible local infrastructure—Docker Compose, PostgreSQL, Python, and Streamlit—rather than claiming cloud scale before it exists. This keeps the resilience behavior testable and portable. Managed PostgreSQL and public Streamlit or application hosting are logical future deployment steps.